
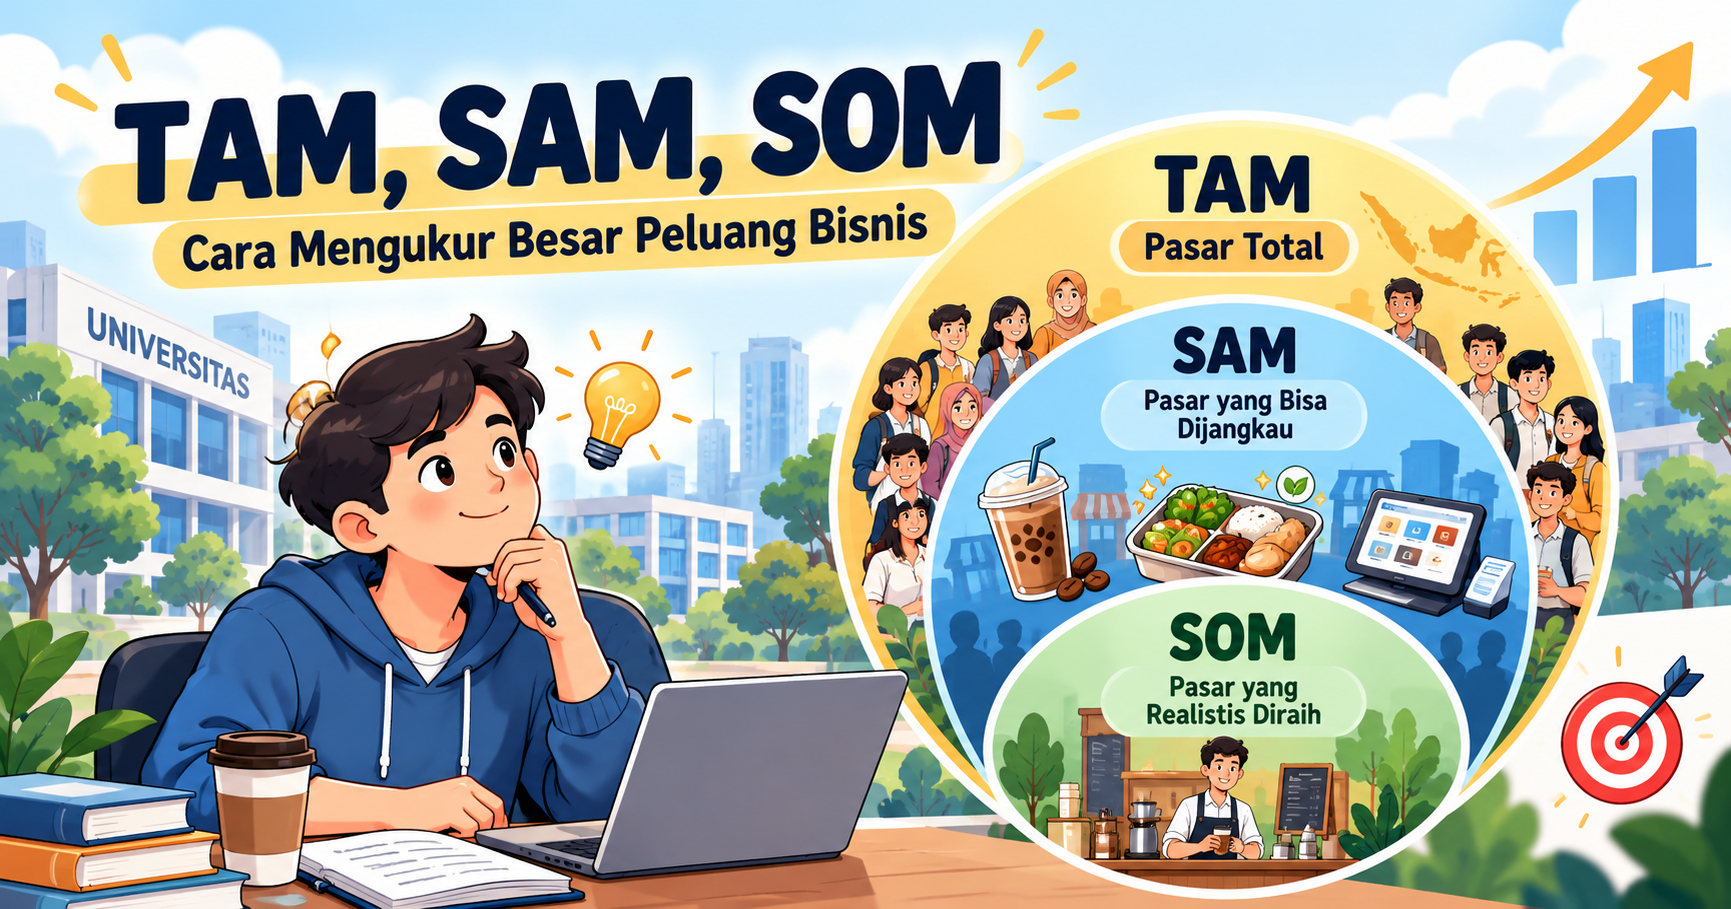
Banyak ide bisnis terdengar hebat di atas kertas, tetapi tidak semuanya punya pasar yang cukup besar untuk tumbuh. Di sinilah konsep TAM, SAM, dan SOM berperan. Tiga singkatan ini membantu seorang calon entrepreneur menjawab pertanyaan paling mendasar: “Seberapa besar sebenarnya peluang bisnis saya?”
1. TAM (Total Addressable Market): Seberapa Besar Kuenya?
TAM adalah ukuran pasar paling luas, yaitu total nilai belanja seluruh orang yang punya kebutuhan sama dengan yang ingin Anda layani. Di tahap ini kita belum memikirkan lokasi, modal, atau pesaing. Kita hanya bertanya: jika semua orang yang membutuhkan produk ini membelinya, berapa nilai pasarnya?
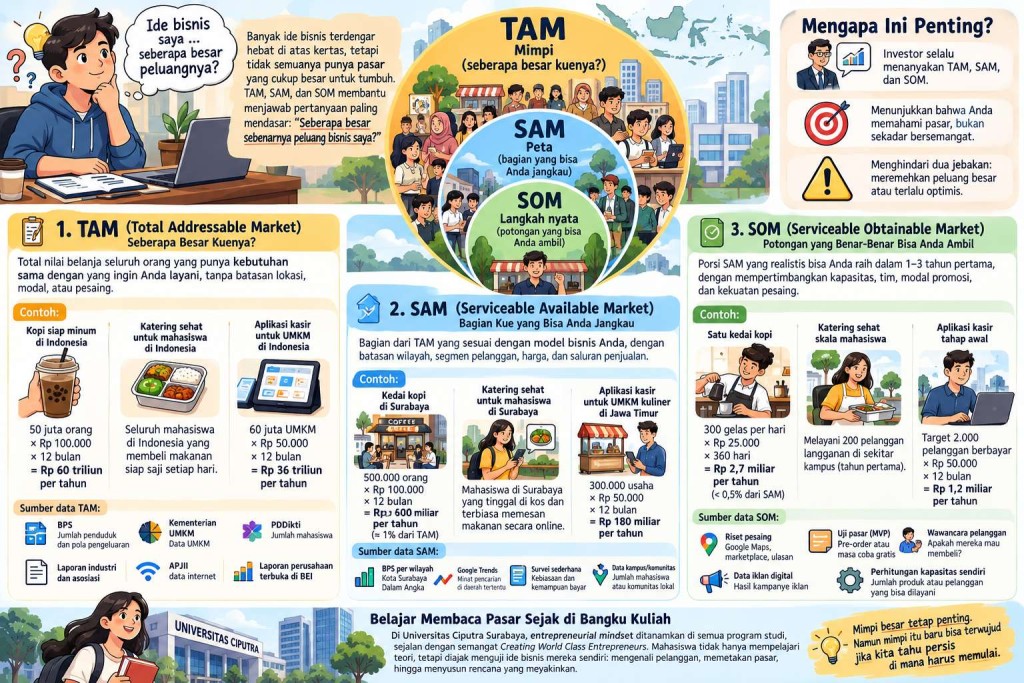
Contoh: Anggap saja ada 50 juta orang di Indonesia yang rutin membeli kopi siap minum, dengan rata-rata belanja Rp 100.000 per bulan. Maka TAM-nya adalah 50 juta × Rp 100.000 × 12 bulan = Rp 60 triliun per tahun.
Contoh usaha mahasiswa: Jika Anda ingin membuat layanan katering sehat untuk anak kos, TAM-nya adalah seluruh mahasiswa di Indonesia yang membeli makanan siap saji setiap hari.
Contoh startup teknologi digital: Anda membuat aplikasi kasir dan pembukuan berbasis langganan untuk UMKM seharga Rp 50.000 per bulan. Misalkan ada 60 juta UMKM di Indonesia. TAM-nya adalah 60 juta × Rp 50.000 × 12 bulan = Rp 36 triliun per tahun.
Angka TAM biasanya sangat besar dan terdengar menggiurkan. Gunanya adalah menunjukkan potensi jangka panjang sebuah ide. Namun, jangan berhenti di sini. Tidak ada bisnis baru yang bisa merebut seluruh pasar sekaligus, dan investor tahu itu.
Pertimbangan dan sumber data TAM: Tentukan dulu kebutuhan apa yang Anda selesaikan, siapa saja yang memiliki kebutuhan itu, dan berapa rata-rata nilai belanjanya per tahun. Data skala nasional bisa diperoleh dari:
- Badan Pusat Statistik (BPS): jumlah penduduk, pola pengeluaran rumah tangga, dan data per sektor usaha.
- Kementerian UMKM: data jumlah dan sebaran UMKM, berguna untuk bisnis yang menyasar pelaku usaha.
- PDDikti: jumlah mahasiswa dan perguruan tinggi di Indonesia.
- Laporan industri dan asosiasi: misalnya laporan e-Conomy SEA (Google, Temasek, Bain) untuk ekonomi digital, atau APJII untuk jumlah pengguna internet.
- Laporan tahunan perusahaan terbuka di Bursa Efek Indonesia, yang sering memuat gambaran ukuran industri.
2. SAM (Serviceable Available Market): Bagian Kue yang Bisa Anda Jangkau
SAM adalah bagian dari TAM yang sesuai dengan model bisnis Anda. Di sini kita mulai memberi batasan: di mana bisnis beroperasi, siapa target pelanggannya, berapa kisaran harganya, dan lewat saluran apa produk dijual. Semakin jelas batasannya, semakin realistis gambaran pasar Anda.
Contoh: Anda membuka kedai kopi kekinian di Surabaya dengan harga Rp 20.000–30.000 per gelas, menyasar mahasiswa dan pekerja muda. Misalkan ada 500.000 orang di Surabaya yang masuk kriteria tersebut dengan belanja kopi Rp 100.000 per bulan. Maka SAM-nya adalah 500.000 × Rp 100.000 × 12 bulan = Rp 600 miliar per tahun, atau sekitar 1% dari TAM.
Contoh usaha mahasiswa: Untuk katering sehat tadi, SAM-nya adalah mahasiswa di Surabaya yang tinggal di kos dan terbiasa memesan makanan secara online.
Contoh startup teknologi digital: Aplikasi kasir tadi awalnya fokus pada UMKM kuliner di Jawa Timur yang sudah memakai smartphone dan bersedia membayar langganan. Jika jumlahnya sekitar 300.000 usaha, SAM-nya adalah 300.000 × Rp 50.000 × 12 bulan = Rp 180 miliar per tahun.
SAM membantu Anda fokus. Daripada mencoba melayani semua orang, Anda tahu persis kepada siapa produk ini dibuat.
Pertimbangan dan sumber data SAM: Persempit TAM dengan empat pertanyaan: di wilayah mana Anda beroperasi, segmen pelanggan mana yang dituju, apakah harga Anda terjangkau bagi mereka, dan lewat saluran apa mereka membeli. Data pendukungnya bisa diperoleh dari:
- Publikasi “Dalam Angka” BPS per provinsi dan kota, misalnya Kota Surabaya Dalam Angka 2026, untuk data penduduk dan usaha di wilayah tertentu.
- Google Trends untuk melihat minat pencarian suatu produk di daerah tertentu.
- Survei sederhana lewat Google Forms atau media sosial untuk mengetahui kebiasaan dan kemampuan bayar target pelanggan.
- Data internal kampus atau komunitas, misalnya jumlah mahasiswa per kampus di PDDikti atau anggota komunitas bisnis lokal.
3. SOM (Serviceable Obtainable Market): Potongan yang Benar-Benar Bisa Anda Ambil
SOM adalah porsi SAM yang realistis bisa Anda raih dalam satu sampai tiga tahun pertama. Untuk menghitungnya, pertimbangkan kapasitas produksi, jumlah tim, modal promosi, serta kekuatan pesaing yang sudah ada. SOM inilah dasar target penjualan dan rencana keuangan Anda.
Contoh: Satu kedai kopi Anda mampu melayani sekitar 300 gelas per hari dengan harga rata-rata Rp 25.000, buka 360 hari setahun. Maka SOM-nya adalah 300 × Rp 25.000 × 360 = Rp 2,7 miliar per tahun, atau kurang dari 0,5% dari SAM. Terlihat kecil, tetapi angka inilah yang paling bisa dipertanggungjawabkan.
Contoh usaha mahasiswa: Dengan dapur kecil dan dua orang kurir, katering sehat Anda mungkin bisa melayani 200 pelanggan langganan di sekitar kampus. Itulah SOM Anda untuk tahun pertama.
Contoh startup teknologi digital: Dengan tim kecil dan anggaran pemasaran digital yang terbatas, target realistis tahun pertama adalah 2.000 pelanggan berbayar. SOM-nya adalah 2.000 × Rp 50.000 × 12 bulan = Rp 1,2 miliar per tahun. Keunggulan bisnis digital adalah biaya melayani pelanggan tambahan relatif rendah, sehingga SOM bisa tumbuh cepat begitu produk terbukti disukai pasar.
Ingat, SOM yang terlalu besar justru menjadi tanda bahaya. Angka kecil yang masuk akal jauh lebih meyakinkan daripada angka besar yang sulit dibuktikan.
Pertimbangan dan sumber data SOM: SOM lebih banyak ditentukan oleh kemampuan bisnis Anda sendiri dan kondisi persaingan. Pertimbangkan kapasitas produksi atau layanan, jumlah tim, anggaran pemasaran, dan berapa pelanggan yang sudah direbut pesaing. Datanya bisa diperoleh dari:
- Riset pesaing: jumlah dan lokasi pesaing lewat Google Maps, marketplace, atau aplikasi pesan antar, beserta harga dan ulasan mereka.
- Uji pasar (MVP): jual versi sederhana produk Anda, buka pre-order, atau jalankan masa uji coba gratis untuk mengukur berapa orang yang benar-benar membeli.
- Wawancara calon pelanggan: tanyakan langsung apakah mereka mau membeli dan berapa harga yang wajar menurut mereka.
- Data iklan digital: hasil kampanye kecil di media sosial menunjukkan berapa persen orang yang melihat iklan lalu benar-benar mendaftar atau membeli.
- Perhitungan kapasitas sendiri: berapa banyak produk atau pelanggan yang sanggup Anda layani dengan sumber daya yang ada.
Catatan: angka-angka di atas adalah ilustrasi untuk memudahkan pemahaman, bukan data pasar sebenarnya.
Bayangkan tiga lingkaran yang semakin mengecil. Lingkaran terbesar adalah mimpi, lingkaran tengah adalah peta, dan lingkaran terkecil adalah langkah nyata yang bisa diambil hari ini.
Mengapa Ini Penting?
Investor hampir selalu menanyakan TAM, SAM, dan SOM saat mendengar presentasi bisnis. Angka-angka ini menunjukkan bahwa pendiri usaha memahami pasarnya, bukan sekadar bersemangat. Selain itu, perhitungan yang jujur membantu entrepreneur menghindari dua jebakan: meremehkan peluang besar, atau terlalu optimis hingga kehabisan modal.
Cara menghitungnya pun bisa dilatih. Ada pendekatan top-down yang dimulai dari data industri lalu dipersempit, dan pendekatan bottom-up yang dimulai dari jumlah calon pelanggan dikalikan harga produk. Entrepreneurs yang matang biasanya menggunakan keduanya untuk saling mengecek.
Belajar Membaca Pasar Sejak di Bangku Kuliah
Kemampuan seperti ini tidak lahir begitu saja. Di Universitas Ciputra Surabaya, entrepreneurial mindset ditanamkan di semua program studi, sejalan dengan semangat Creating World Class Entrepreneurs. Mahasiswa tidak hanya mempelajari teori, tetapi diajak menguji ide bisnis mereka sendiri: mengenali pelanggan, memetakan pasar, hingga menyusun rencana yang meyakinkan.
Bagi calon mahasiswa, ini berarti kesempatan untuk mulai membangun usaha sejak dini dengan pendampingan yang tepat. Bagi orang tua, ini adalah jaminan bahwa putra-putri mereka dibekali cara berpikir yang terukur, bukan sekadar nekat.
Karena di dunia bisnis, mimpi besar tetap penting. Namun mimpi itu baru bisa terwujud jika kita tahu persis di mana harus memulai.
Mapping Market Opportunities TAM, SAM, and SOM
TAM, SAM, SOM: How Young Entrepreneurs Read Market Opportunities Before Taking the Leap
Many business ideas sound brilliant on paper, but not all of them have a market big enough to grow. That is where TAM, SAM, and SOM come in. These three acronyms help aspiring entrepreneurs answer the most basic question of all: “How big is my business opportunity, really?”
1. TAM (Total Addressable Market): How Big Is the Pie?
TAM is the widest measure of a market: the total spending of everyone who has the same need you want to serve. At this stage, we are not yet thinking about location, capital, or competitors. We simply ask: if everyone who needs this product bought it, how much would the market be worth?
Example: Suppose there are 50 million people in Indonesia who regularly buy ready-to-drink coffee, spending an average of IDR 100,000 per month. The TAM is 50 million × IDR 100,000 × 12 months = IDR 60 trillion per year.
Student business example: If you want to launch a healthy meal subscription for students living in boarding houses, your TAM is every university student in Indonesia who buys ready-made meals daily.
Digital tech startup example: You build a subscription-based point-of-sale and bookkeeping app for small businesses (MSMEs), priced at IDR 50,000 per month. Suppose there are 60 million MSMEs in Indonesia. The TAM is 60 million × IDR 50,000 × 12 months = IDR 36 trillion per year.
TAM figures are usually huge and sound exciting. Their purpose is to show the long-term potential of an idea. But don’t stop here. No new business can capture an entire market at once, and investors know it.
What to consider and where to find TAM data: First define the need you solve, who has that need, and how much they spend on average per year. National-level data can come from:
- Statistics Indonesia (BPS): population, household spending patterns, and data by business sector.
- Ministry of MSMEs: the number and distribution of small businesses, useful if your customers are business owners.
- PDDikti: the number of university students and institutions in Indonesia.
- Industry and association reports: for example, the e-Conomy SEA report (Google, Temasek, Bain) for the digital economy, or APJII for internet user numbers.
- Annual reports of listed companies on the Indonesia Stock Exchange, which often describe the size of their industry.
2. SAM (Serviceable Available Market): The Slice You Can Reach
SAM is the part of the TAM that fits your business model. This is where you start setting boundaries: where the business operates, who the target customers are, what the price range is, and which channels you sell through. The clearer the boundaries, the more realistic your picture of the market.
Example: You open a trendy coffee shop in Surabaya, charging IDR 20,000–30,000 per cup and targeting students and young professionals. Suppose 500,000 people in Surabaya fit that profile and spend IDR 100,000 a month on coffee. The SAM is 500,000 × IDR 100,000 × 12 months = IDR 600 billion per year, or about 1% of the TAM.
Student business example: For the healthy meal subscription, your SAM is students in Surabaya who live in boarding houses and are used to ordering food online.
Digital tech startup example: At first, the app focuses on food and beverage MSMEs in East Java that already use smartphones and are willing to pay for a subscription. If there are about 300,000 of them, the SAM is 300,000 × IDR 50,000 × 12 months = IDR 180 billion per year.
SAM helps you focus. Instead of trying to serve everyone, you know exactly who your product is made for.
What to consider and where to find SAM data: Narrow down your TAM with four questions: which area you operate in, which customer segment you target, whether your price fits their budget, and which channels they buy through. Supporting data can come from:
- BPS “Dalam Angka” (In Figures) publications for each province and city, such as Surabaya Municipality in Figures 2026, for local population and business data.
- Google Trends to see search interest for a product in a specific region.
- Simple surveys via Google Forms or social media to learn your target customers’ habits and willingness to pay.
- Campus or community data, such as student numbers per university on PDDikti or members of local business communities.
3. SOM (Serviceable Obtainable Market): The Piece You Can Actually Take
SOM is the share of your SAM you can realistically win in your first one to three years. To estimate it, consider your production capacity, team size, marketing budget, and the strength of existing competitors. Your SOM becomes the basis for sales targets and financial plans.
Example: Your coffee shop can serve about 300 cups a day at an average of IDR 25,000, open 360 days a year. The SOM is 300 × IDR 25,000 × 360 = IDR 2.7 billion per year, less than 0.5% of the SAM. It looks small, but it is the number you can defend most confidently.
Student business example: With a small kitchen and two couriers, your healthy meal business might serve 200 regular subscribers around campus. That is your first-year SOM.
Digital tech startup example: With a small team and a limited digital marketing budget, a realistic first-year target is 2,000 paying customers. The SOM is 2,000 × IDR 50,000 × 12 months = IDR 1.2 billion per year. The advantage of a digital business is that serving each additional customer costs relatively little, so the SOM can grow quickly once the product proves the market wants it.
Remember, an oversized SOM is actually a red flag. A small number that makes sense is far more convincing than a big number that is hard to prove.
What to consider and where to find SOM data: SOM depends mostly on your own capabilities and the competitive landscape. Consider your production or service capacity, team size, marketing budget, and how many customers competitors already hold. Data can come from:
- Competitor research: the number and location of competitors on Google Maps, marketplaces, or delivery apps, along with their prices and reviews.
- Market testing (MVP): sell a simple version of your product, open pre-orders, or run a free trial to measure how many people actually buy.
- Customer interviews: ask potential customers directly whether they would buy and what price feels fair.
- Digital ad data: small social media campaigns show what percentage of people who see an ad actually sign up or buy.
- Your own capacity calculation: how many products or customers you can serve with your current resources.
Note: the figures above are illustrations to aid understanding, not actual market data.
Picture three circles, each smaller than the last. The largest circle is the dream, the middle one is the map, and the smallest is the real step you can take today.
Why Does It Matter?
Investors almost always ask about TAM, SAM, and SOM when they hear a business pitch. These numbers show that founders understand their market, not just that they are passionate. An honest calculation also helps entrepreneurs avoid two traps: underestimating a big opportunity, or being so optimistic that they run out of capital.
The good news is that this skill can be learned. A top-down approach starts from industry data and narrows it down, while a bottom-up approach multiplies the number of potential customers by the product price. Seasoned entrepreneurs usually use both to cross-check their figures.
Learning to Read the Market While Still in College
Skills like these do not appear overnight. At Universitas Ciputra Surabaya, an entrepreneurial mindset is built into every study program, in line with the spirit of Creating World Class Entrepreneurs. Students do not just study theory; they are encouraged to test their own business ideas: understanding customers, mapping the market, and building a convincing plan.
For prospective students, this means a chance to start building a venture early, with the right guidance along the way. For parents, it is reassurance that their sons and daughters are equipped with a measured way of thinking, not just bold ambition.
Because in business, big dreams still matter. But those dreams only come true when you know exactly where to begin.